

Key Points
- Protein analysis is the set of laboratory methods used to detect, identify, measure, separate, and characterize proteins in a sample.
- The right method depends on the question. Total-protein assays estimate concentration, gels separate proteins, immunoassays detect selected targets, chromatography resolves mixtures, and mass spectrometry can identify many proteins and modifications.
- Sample collection, extraction, controls, normalization, and data review often determine whether the result is interpretable.
- A strong beginner workflow starts with a clearly defined biological question, then selects the simplest method that can answer it with appropriate controls.
Proteins carry out much of a cell’s day-to-day work. They catalyze reactions, move materials, transmit signals, provide structure, and help cells respond to their environment. Protein analysis is the broad name for laboratory work that asks what proteins are present, how much is present, whether a protein has changed, and sometimes how it is folded or modified.
That breadth explains why there is no single “protein test.” A laboratory measuring one known biomarker in blood has a different task from a discovery group cataloging thousands of proteins in cultured cells. Both are doing protein analysis, but their sample preparation, instruments, controls, and data requirements differ.
What Is a Protein?
A protein is a chain of amino acids that folds into a three-dimensional form. The amino-acid sequence influences the protein’s structure and function, but the story does not end there. Cells may cut proteins into smaller forms or add chemical groups such as phosphates or sugars. These post-translational modifications can change activity, location, stability, or interactions.
The proteome is the full set of proteins expressed in a cell, tissue, organism, or sample at a particular time. Proteomics is the large-scale study of that set. By comparison, a targeted protein assay focuses on one protein or a defined panel.
The distinction matters because proteins cannot be inferred perfectly from DNA or RNA alone. A gene may be transcribed without producing a stable protein, and the amount or modified form of a protein may change after transcription. Protein measurements therefore give laboratories a direct view of many functional biological changes.
What Questions Can Protein Analysis Answer?
Most projects begin with one or more of five practical questions:
- How much total protein is in the sample? Colorimetric or fluorescent assays can estimate the concentration of all extracted protein before downstream work.
- Is a particular protein present? Antibody-based methods, including Western blotting and immunoassays, can detect a selected target.
- How much of that target is present? A calibrated immunoassay, targeted mass-spectrometry method, or another quantitative platform may measure concentration or relative abundance.
- Which proteins are present? Mass spectrometry can identify peptides and infer their source proteins, often across complex mixtures.
- What form is the protein in? Chromatography, electrophoresis, mass spectrometry, and structural methods can reveal size, charge, aggregation, modifications, or conformation.
The U.S. Food and Drug Administration’s biomarker framework emphasizes that a useful measurement is tied to a defined source or matrix, measurable characteristic, and analytical method. That is a helpful beginner principle even outside regulated biomarker work: define the sample, the measurand, and the intended interpretation before choosing the assay.
Core Protein Analysis Methods
Total-Protein Assays
Total-protein assays estimate how much protein is present in an extract. They are commonly used to normalize sample loading so that differences observed later are less likely to reflect unequal input. No assay is universally best. Detergents, reducing agents, buffer composition, concentration range, and available standards can influence method choice and performance.
Gel Electrophoresis
Gel electrophoresis separates proteins as they move through a porous matrix under an electric field. In SDS-PAGE, detergent unfolds many proteins and gives them a broadly similar charge-to-mass relationship, so separation primarily reflects molecular size. A stained gel can show the overall protein pattern, while a molecular-weight ladder provides a size reference.
Western Blotting
A Western blot begins with gel separation, transfers proteins to a membrane, and uses antibodies to detect a target. The method can provide evidence about presence, approximate size, and relative abundance. Interpretation depends on antibody specificity, transfer performance, exposure range, loading controls, and whether the measured signal remains within a useful quantitative range.
Immunoassays
Immunoassays use binding reagents, usually antibodies, to recognize target proteins. Enzyme-linked immunosorbent assays, or ELISAs, are common when a laboratory needs to measure a known analyte across many samples. A valid quantitative assay needs a suitable calibration model, quality-control samples, acceptable precision, adequate selectivity, and a verified reportable range. Current FDA guidance for biomarker assays highlights these same performance concepts for measurements in biological matrices.
Chromatography
Chromatography separates proteins or peptides according to properties such as size, charge, hydrophobicity, or affinity. It may be used to purify a protein, inspect product-related variants, or reduce sample complexity before another analysis. The chromatogram is a signal plotted over time, with peaks representing components that reach the detector at different points.
Mass Spectrometry
Mass spectrometry measures ions according to their mass-to-charge ratio. In a common bottom-up proteomics workflow, proteins are digested into peptides, the peptides are separated by liquid chromatography, and a mass spectrometer collects spectra used for identification and quantification. A National Institute of Standards and Technology overview describes bottom-up proteomics as the prevailing large-scale strategy and explains why multiple preparation and acquisition choices exist.
Mass spectrometry can examine many proteins without requiring an antibody for each target, but the method introduces its own decisions about digestion, acquisition, search databases, false-discovery control, missing values, normalization, and data reporting. For laboratories considering the instrument side of this workflow, LabPress’s guide to LC-MS systems for regulated quality-control laboratories provides additional purchasing context, while this report on standardized proteomics workflows illustrates the operational push toward consistent processing.
An Accessible Biotechnology Workflow
Illustrative example: A biotechnology team wants to know whether a treatment increases production of a recombinant protein in cultured cells.
- Define the comparison. The team identifies treated and untreated groups, biological replicates, the target protein, the expected molecular size, and the decision the result will support.
- Collect samples consistently. Cells are harvested at the same time point under a written protocol. Temperature, processing delay, and storage conditions are recorded because proteins can degrade or change after collection.
- Extract proteins. A buffer releases proteins while protease inhibitors help limit degradation. If phosphorylation is being studied, phosphatase inhibitors may also be necessary.
- Measure total protein. The team estimates concentration and dilutes extracts to comparable levels. This step supports equal loading and makes unusually low-yield samples easier to identify.
- Run SDS-PAGE and a Western blot. The gel separates proteins by size, and an antibody detects the recombinant target. A loading or total-protein control helps the team interpret relative signal.
- Review controls before the treatment effect. The team checks the positive control, negative control, expected band position, background, and exposure range. A brighter target band is meaningful only if the analytical controls behaved as intended.
- Confirm when the decision requires it. If the result will guide a major development decision, the team may add an orthogonal method, such as a calibrated immunoassay or targeted mass-spectrometry measurement.
This workflow is intentionally simple, but it shows the logic that scales to more complex studies. Start with the question, control preanalytical variation, check sample quantity, select a fit-for-purpose measurement, and assess controls before drawing a biological conclusion.
Controls, Replicates, and Normalization
A positive control should produce a signal and helps show that the detection system can work. A negative control should not produce the target signal and helps reveal nonspecific binding or contamination. A blank contains the assay matrix or reagents without the analyte and can expose background. A standard has an assigned or prepared concentration and supports calibration.
Technical replicates repeat the measurement process and help estimate analytical variability. Biological replicates represent independent biological units and support conclusions about biological variation. They answer different questions, so repeating one sample several times is not a substitute for independent biological material.
Normalization adjusts results so samples can be compared on a meaningful basis. Examples include loading equal total protein, normalizing a target to total-protein signal, or applying a data-processing method to mass-spectrometry intensities. The normalization plan should be chosen before inspecting the desired outcome because a poorly justified denominator can distort the result.
Common Failure Modes
- Protein degradation: Slow processing, unsuitable temperature, or repeated freeze-thaw cycles can alter the sample before measurement.
- Matrix interference: Salts, detergents, lipids, abundant proteins, and other components can change assay response or ionization.
- Antibody problems: Cross-reactivity, lot variation, insufficient validation, or a target modification can produce misleading bands or signals.
- Signal saturation: A detector may stop responding proportionally at high signal levels, making large differences appear smaller.
- Batch effects: Reagent lots, plates, operators, acquisition days, or instrument conditions can create structured differences unrelated to biology.
- Database and search choices: In proteomics, the selected sequence database, search settings, and false-discovery thresholds influence identification results.
For quantitative or regulated work, validation should match the intended use. The FDA’s Q2(R2) guidance on analytical procedure validation provides a general framework, and its 2026 biomarker assay guidance addresses measurement of biomarker concentrations in biological matrices. These documents are not universal protocols for every research assay, but they show how performance characteristics should connect to a method’s purpose.
How to Choose a Starting Method
Choose the method by matching the question to the evidence needed. Use a total-protein assay when the immediate need is concentration. Use gel electrophoresis to inspect a mixture or confirm an approximate size pattern. Use a Western blot or immunoassay when the target is known and a suitable antibody exists. Use chromatography when separation or purification is central. Use mass spectrometry when identification, broader coverage, modification mapping, or highly selective targeted measurement is required.
Then test the practical fit. Consider sample amount, matrix complexity, expected concentration, throughput, required precision, staff expertise, turnaround time, data-analysis capacity, and whether an orthogonal confirmation is necessary. The most sophisticated method is not automatically the most appropriate. The best method is the one that answers the defined question with controlled uncertainty.
Data Stewardship and Reporting
Protein analysis produces more than a final chart. Laboratories should retain sample identifiers, preparation records, reagent and antibody details, instrument settings, calibration and quality-control results, processing parameters, and versioned analysis outputs. Large-scale proteomics projects can also deposit data in community resources such as the ProteomeXchange Consortium, which coordinates public proteomics repositories.
Clear reporting separates observation from interpretation. “A band appeared near the expected molecular weight” is an observation. “The treatment increased functional protein” is a broader claim that may require quantitative controls and evidence of activity. That distinction helps beginners avoid asking one method to support more than it can show.
A Beginner’s Protein Analysis Checklist
- State the biological question and intended decision.
- Define the sample matrix, target, and expected concentration range.
- Choose a method that directly addresses the question.
- Document collection, storage, extraction, and normalization.
- Include positive, negative, blank, and calibration controls as appropriate.
- Distinguish technical from biological replicates.
- Confirm that the signal is within the method’s useful range.
- Review controls and quality criteria before interpreting group differences.
- Use an orthogonal method when the consequence of a wrong conclusion is high.
- Retain raw data, processing settings, and a clear audit trail.
Reader Question
What do you need to learn from the sample first: total concentration, the amount of one known target, or the identity of many proteins? That answer usually narrows the method choice more effectively than starting with an instrument name.
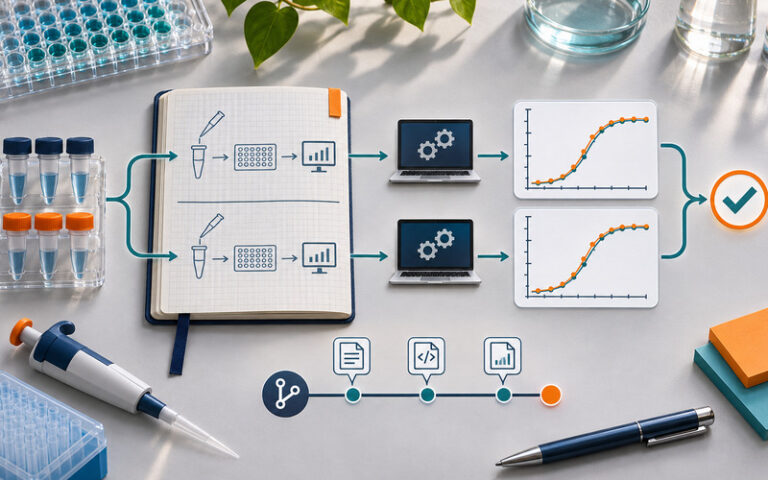
Featured image attribution: OpenAI-generated editorial illustration for LabPress.
Keep Exploring
Related Reading
Research Reproducibility Explained for Beginners
A beginner’s guide to research reproducibility, from study design and data lineage to independent analysis replay, failure modes, and…Read Article
Teaching Laboratories Explained for Beginners
A beginner-friendly guide to teaching laboratories, including the people, equipment, safety controls, workflows, limitations, and practical habits that turn…Read Article




Leave a Reply